

404.php - The AltSignals AltAlgo™ Indicator
1) What is the AltAlgo™ and how does it work?
The AltAlgo™ is an advanced indicator that uses many different variables in conjunction with each other to give the best possible buy and sell signals on chart (crypto, forex, gold, indices,…).
When the indicator is added and set up, it will alert you when it’s time to buy or sell a particular asset.
The AltAlgo™ works on all pairsand charts regardless of the exchange you use.
However, if you want to use a particular exchange (for example, Binance), add your indicator to the Binance-specific chart for optimal results. Different exchanges have different prices for other assets, so keep that in mind.
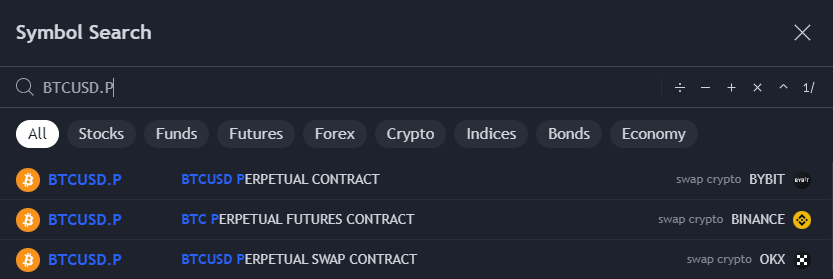
Also, there is a difference in selecting the correct charts, for example BTCUSDT or BTCUSDT.P.
This is important for backtesting results because they will be different.
If you want to trade futures, you have to select the “.P” pair for each coin. If you’re going to trade spot, you have to choose the normal USDT pair (for Binance for example BTCUSDT).
2) How to get the AltAlgo™?
The AltAlgo™ can be purchased on the AltSignals website: https://altsignals.io/join
Currently, you can only purchase a lifetime subscription for the AltAlgo because the monthly subscription is suspended.
As soon as we have verified your purchase, the AltAlgo™ will be added to your TradingView account and you can start using it on your charts.
NOTE 1: You need a TradingView subscription to use our indicator.
NOTE 2: The limitations of your TradingView subscription will impact the backtesting results of our indicator, as seen below.

TradingView “Premium” will give you the maximum available history of backtesting results (20.000 bars).
TradingView “Pro” and “Pro+” will give you only half of the maximum available history of backtesting results (10.000 bars).
TradingView “Basic” will give you only a quarter of the maximum available history of backtesting results (5.000 bars).
This will also depend on the timeframe that is used. On smaller timeframes (for example 1m-5m), the available backtesting history will be shorter than on higher timeframes (for example 30m -60m).
3) The version that we offer.

“AltAlgo” – the latest version
(when added to the chart the name at the time of writing will be “AltAlgo v6.1” *)
It combines backtesting and alert creation so you only need one indicator.
* – version number can change in the future
For a tutorial on how to use the previous version (< 6.0), please watch this video
4) Detailed overview of the AltAlgo™ features.
When adding a script to your charts, you will see something like this:

NOTE: the name or numbering of the indicator might be different on your chart depending on the latest released version.
Once added to the chart you can take a look at the settings by clicking the gear icon.

4.1) Note field
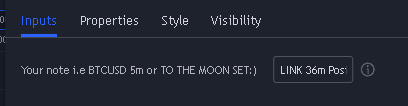
The first field is for adding a text note to your indicator setup. This can be useful when you have several indicators on one chart so you can see what indicator you have set up for which timeframe. In this example I named it “LINK 36m”, so I can remember this indicator set up is for LINK on the 36m timeframe.
PRO TIP: Most features have an info bubble next to the field. Use those to understand the feature better.
4.2) Active period

Here you can select the period from where you want the AltAlgo to start generating signals. This is useful if you test a strategy only for a certain period or from a specific starting point.
Depending on your TradingView subscription (see point 2), you will have a limitation on available historical bars. In the backtesting period you can select how far you want to test your results.
PRO TIP: the further you backtest, the more versatile and robust your setup will be since there is more data to take into account.
4.3) Signal Sensitivity

This section covers the core features of the AltAlgo™. The power signal frequency is an algorithm that generates BUY and SELL signals depending on the input value. The lower the value, the more signals are generated; the higher the value, the fewer signals are generated. It determines the sensitivity to the trend.
There are two AltFilters to detect the trend even further. Both have the same function. We added two to make it more versatile and powerful. Lower values detect the trend more aggressively, meaning more signals. Higher values are more careful and generate fewer signals. By combining both, you can detect the trend more precisely.
4.4) Supertrend

Supertrend is a popular indicator based on ATR multiplier and ATR length. In most cases, it is used to trail stop losses. We’ve taken a different approach and added it as a trend filter. Rules are the same as our MultiMA implementation (described further below). If the current price is above Supertrend, only BUYs are allowed; below Supertrend, only SELLs are permitted. Our implementation of Supertrend is multi-timeframe which means you can use it only from a timeframe equal or higher to the current chart i.e., if your chart is 5min you can use Supertrend from 15min or 1h timeframe to get a better macro trend indication.
Using timeframes lower than the current chart timeframe leads to the repainting of indicator and is not recommended!!!
The Multiplier is used to multiply the average ATR value from the last x candles (ATR Period). In other words, these inputs set the Supertrend line closer or further to the price line.
+1 candle confirmation option force algo to wait one additional candle after direction change to allow trade
in the new direction.
4.5) ADX

ADX (Average Directional Index) is a commonly used indicator to measure trend strength. It is calculated on the basis of DI+/DI- values. You can use ADX (Average Directional Index) to filter AltAlgo signals.
A higher ADX value means a stronger trend (any direction). Common values are: 0-25 (absent or weak trend); 25-50 (strong trend); 50-75 (very strong trend), 75-100 (extremely strong trend). The default threshold to open trade is 25. ADX by default, uses the last 14 candles to smooth the curve.
DI+/DI- measure bullish and bearish momentum. When DI+ is bigger than DI- means uptrend and when DI- is bigger than DI+ it means downtrend. You can use that dependency to filter AltAlgo signals.
Only BUY signals are allowed when DI+ > DI-, and only SELL signals are allowed when DI- > DI+.
DI+/DI- are by default calculated on the last 14 candles basis.
4.6) VWAP
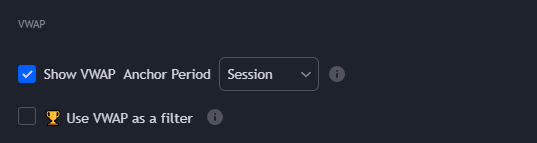
The Volume-Weighted Average Price (VWAP) is an intraday technical analysis tool that resets each trading day. It serves as a benchmark, indicating the average price of a security, factoring in both its volume and price. VWAP offers valuable insights to traders about a security’s trend and value, helping to guide trading decisions. Although the VWAP is mostly anchored to a given session, some use it using higher anchor points like week, month, quarter, or year. You can use VWAP to better navigate through the chart or use it as a filter for AltAlgo signals. If the price is above VWAP, only BUY signals are allowed; if the price is below it, only SELL signals can pass the filter.
4.7) Signal Mode / Breakeven / Trailing

If you want to trade spot and you only want long signals, the short signals can be deselected here and vice versa. “Close on opposite signals” means that when you are in a long and the AltAlgo™ generates the short signal, the long will be closed. When deselected, the opposite signal will not close the previous signals. Signal will be closed only when stop loss or highest take-profit hit. This is useful when you want to trade in hedge mode.
NOTE 1: Please check if your exchange supports hedge mode before developing a strategy on it.
NOTE2: Cornix does NOT support hedge mode on Binance Futures as of now (only on ByBit). So, if you autotrade Binance using Cornix, always check the “Close on opposite signals” box to have reliable signals and backtesting results. More info here.
The breakeven settings can minimize your losses when trading.
The AltAlgo™ provides the functionality to move SL to BE after hitting a specific TP by simply activating the checkbox and choosing your TP.
You can also choose to trail your SL to protect your profits. A trailing SL means that the SL will be moved on every step when a specific TP is hit.
For example: if you select trailing stop on TP1. When TP1 is hit, SL will move to BE; when TP2 is hit, SL will move to TP1; when TP3 is hit, SL will move to TP2, etc.
Please only select either “Move SL to BE” OR “Trail SL after TP hit” for reliable signals and the backtest results, NOT both.
PRO TIP: When you have developed a valuable strategy, you can use Cornix to set your trailing SL automatically according to your strategy. For more info, see here
Also you can refer to this post: https://t.me/c/1167145651/29024 if you use Cornix and would like to send trailing information within the signal (Cornix will parse it and set the correct trailing type for the given signal)
4.8) Money Management

In this important part of the indicator, we set our TPs and SL.
But first, we need to select how we want to represent our values: in pips, % or ATR. We can choose the value for TPs and SL separately. In case we have chosen ATR also ATR period is separate for TP and SL.

4.8.1) pips
Pips are helpful if you are trading FX; if you don’t know what pips are, please see here.

We can also define the desired pip value with the dropdown menu. The most common values are:
- 0.0001 – for all currency pairs except JPY pairs
- 0.010 – for JPY currency pairs
- 0.10 – for gold (XAU)
4.8.2) % – percentage
“%” is more commonly used in crypto and lets you set all values in percentage.
4.8.3) ATR
ATR is an average true range indicator that measures market volatility by decomposing the entire range of an asset price for that period. This is useful to predict optimal and variable TP and SL targets depending on volatility. For more info on ATR, see here.

With the ATR selected, we can change the ATR period (default value 14) to our needs. A lower value will take into account a shorter period and vice versa. A good ATR setup can be more profitable than normal percentages because of the variable TP and SL targets.
4.8.4) Use LONG value for SHORT

This setting is meant to help find base setup for further optimization. When checked, the values from LONG TP and SL column will also be used for SHORT (current values used in the SHORT column will not be taken into account by algo). This is DISABLED by default.
4.8.5) TP, SL, % of trade
TPs and SLs are separate for longs and shorts. This is another way to optimize profits for individual assets.
(LTP1 – long take profit 1; STP1 – short take profit 1, TP1% – % of trade to close on take profit 1)
For example: a crypto pair that is in an obvious uptrend for months but with some slight dips in between. The drops are minimal, and every time there is a dip, it is bought back immediately. In this case, TP and SL for shorts can be set lower than TP and SL for longs. It is minimizing losses and maximizing gains.
The sum of values in the red rectangle (% of trade) should always equal 100%. These values are responsible for the proper calculation of splitting whole trade capital between the take-profit levels during backtesting your strategy. The most common practice is to use an evenly divided approach i.e., when you use all four TP levels % of trade will be 25% for each level.
4.8.6) DCA entry % of price
In this input, you can enter how many % BELOW (for longs) or ABOVE (for shorts) the algo should send an alert to make an additional entry in case the price will go the opposite direction than trade direction so that you can achieve better entry price (Dollar Cost Averaging).

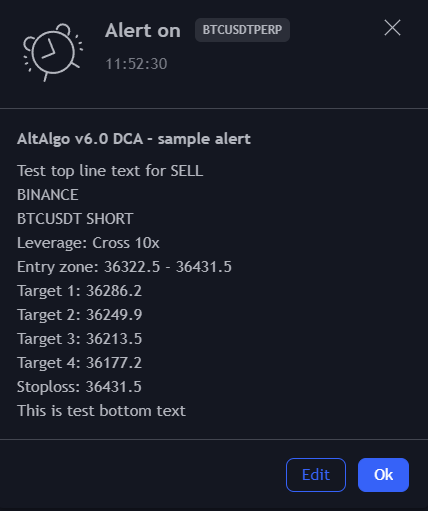
Using this feature will cause the entry price in the alert to change to entry ZONE like (current price – current price +/- %). When you have an entry zone in the alert message, you can use Cornix entry strategies to DCA your position.
For more information about how to set it up with Cornix read here in section Strategies: Entry Strategy and Entry Zone.
4.9) Multi MA
The first section covers enabling/disabling the multi-moving averages.

To enable it, simply check the checkbox. There are 28 different MAs to be chosen from the dropdown menu. These MAs are indicators available on TV, and each has its characteristics. To know their functions, please browse TV or search the internet.
The function of these MA filters is to optimize LONG and SHORT signals. When the price is below the selected MA, algo only accepts SHORT signals, and when the price is above, it only accepts LONG signals.
You can use two instances of MultiMA, they work exactly the same way.
4.9.1) MultiMA Length
This is the length of the chosen MA and can be adjusted accordingly. Lower value means less filtering, so more trades; higher value means more aggressive filtering, so fewer trades. There is no limit for this value, but we suggest not go higher than 1000 if you still want to have a certain number of trades on your chart.
PRO TIP: A good start is values between 100 and 300.
4.10) Market Structure
This section of script settings is responsible for showing Market Structure (LL – lower low, HL – higher low, LH – lower high, HH – higher high) and Order Blocks (area of interest, usually first opposite candle before strong market move up or down)

4.10.1) Show market structure and set Pivot lookup

Show Market Structure – Here you can turn ON/OFF showing market structure on the chart and set pivot detection sensitivity by changing Pivot Lookup input. Remember Pivot points are lagging. It lags by twice the number of bars you choose as a Pivot lookup. If it’s 5, TradingView checks 5 candles on the left and 5 candles on the right (sum is 10, so lag by 10 candles) if the given candle is a valid pivot point (highest or lowest point).
4.10.2) Order Blocks

Order Blocks are areas in the chart where we anticipate bigger players placed their orders and can defend this price area in the future. There are many ways we can define them. This is why they are a bit subjective. We like the idea that OB (Order Block) is formed on the last opposite candle before a significant market move. That is why we have two main inputs that tell AltAlgo where it should look for OB.
OB Trigger % – Minimal % move in last X candles to create Order Block
OB Lookback – Number of candles back used to measure % of price change to create Order Block
Example: OB Trigger % = 2, OB Lookback = 3,
In this case, AltAlgo check difference in price between the current candle and the third candle back. If it is bigger than 2 it will look for the first opposite candle before the third candle back.
OB mitigation by – Algo has to delete mitigated Orders Blocks to free resources of TradingView. You can choose between Wick and Close. If you choose Wick OB will be deleted when High or Low of the candle cross OB, if you choose Close, the candle has to cross OB and close above/below depending type of OB (bullish – OB created before price dump, or bearish – OB created before price pump).
4.10.3) Order Blocks – additional settings
Delete mitigated OB – You can disable deleting mitigated OB for debugging purpose. CAUTION: Depending used timeframe, OB detection sensitivity etc. TradingView may show a timeout error.
Color OB trigger candles – turn ON/OFF coloring candles that meet Order Block trigger criteria
Alert – Price in bullish OB – send alert when price crossunder the top of a bullish Order Block
Alert – Price in bearish OB – send alert when price crossover the bottom of a bearish Order Block
4.10.4) Using Order Blocks as a filter
You can use Order Bloks as a filter for main algo signals. To do this you have to check Use OB as a filter and set OB safe margin%.
Example: OB safe margin % = 0.5
In this case AltAlgo will block:
SELL signals in the zone from 0.5% above to 0.5% below top of the bullish Order Blocks
BUY signals in the zone from 0.5% above to 0.5% below bottom of the bearish Order Blocks
4.11) Sessions

Session mode allows you to disable/enable certain hours/days/time zones or popular trading times.
You can select your preferred time zone in the drop-down menu and use the checkboxes to enable/disable to suit your needs.
4.12) Signal Filtering

Advanced users can filter the AltAlgo™ signals by any indicator they have access to the source code. The AltAlgo™ monitors the connected external script chosen from the dropdown menu, where you should select the plot name used to filter AltAlgo™ signals.
Whenever internal BUY conditions are met, the AltAlgo™ checks if the connected external plot has a value of “1” or “10”; if yes, the script will send a BUY signal.
Whenever internal SELL conditions are met, the AltAlgo™ checks if the connected external plot has a value of
“-1” or “10”; if yes, the script will send a SELL signal.
No signals are sent if the external plot value has no matching value of “1” (BUY allowed), “-1” (SELL allowed), or “10” (both BUY and SELL allowed)
Example:
When you want to filter AltAlgo™ BUY/SELL signals with an external RSI value, you should add an additional plot which shows 1 in the BUY condition (i.e., RSI is above 50) and -1 in the SELL condition (i.e., RSI below 50) to the RSI indicator code. Then add both scripts (AltAlgo™ and your modified RSI indicator) to the chart and choose your newly created plot as a source in “Choose filter source”. Finally, you have to mark the checkbox “Use external filter”.
When the AltAlgo™ is ready to show a BUY or SELL signal, it will check first if the RSI is above/below 50 and send a signal only when both criteria – internal and external – are valid at the same time.
Note: IMPORTANT!!! AltAlgo™ team doesn’t provide support for this feature because this requires knowledge in (pine script) coding.
4.13) Alerts
This part of the settings is responsible for generating alerts for BUYs, SELLs and DCA signals.
Here you can also choose how the alert message looks and what information it should contain.
Here you can turn on/off alerts for BUYs and SELLs:

When checked, AltAlgo will put text from input at the TOP of the alert message. It could be different text for BUY and SELL events:

You can put any text, emoji, etc here.

These fields can also be used to create alert messages for other trading bots than Cornix, like Alertatron, TradingView To Anywhere etc. In that case uncheck all checkboxes and only leave Alerts for BUY / SELL and Top line (free text) checked. Put the messages in BUY / SELL inputs.
In the free text input fields, you can use placeholders, these are special commands that the algo replaces with the proper values during alert sending.
| Available placeholders | ||
| {{close}} – current price in the moment when alert is sent{{ticker}} – ticker used on chart i.e BTCUSDTPERP{{exchange}} – prefix from tickerdid i.e for BINANCE:BTCUSDTPERP will be BINANCE{{br}} – new line{{amount%_TP1}} – amount in % set in Money Management section fot TP1{{amount%_TP2}} – amount in % set in Money Management section fot TP2{{amount%_TP3}} – amount in % set in Money Management section fot TP3{{amount%_TP4}} – amount in % set in Money Management section fot TP4 | ||
| {{Long_Ent_Zone}} – long entry zone{{Long_TP1}} – price of long TP1{{Long_TP2}} – price of long TP2{{Long_TP3}} – price of long TP3{{Long_TP4}} – price of long TP4{{Long_SL}} – price of long stoploss | {{Short_Ent_Zone}} – short entry zone{{Short_TP1}} – price of short TP1{{Short_TP2}} – price of short TP2{{Short_TP3}} – price of short TP3{{Short_TP4}} – price of short TP4{{Short_SL}} – price of short stoploss | |
| Example of free text message for BUY: {{exchange}}{{br}}{{ticker}} LONG{{br}} Entry: {{close}}{{br}}TP1: {{Long_TP1}} – {{amount%_TP1}}{{br}}TP2: {{Long_TP2}} – {{amount%_TP2}}{{br}}TP3: {{Long_TP3}} – {{amount%_TP3}}{{br}}TP4: {{Long_TP4}} – {{amount%_TP4}}{{br}}SL: {{Long_SL}}{{br}} | Result mesage in telegram channel: | |
When checked, the AltAlgo will add the exchange name to the alert message. When it’s checked and the input field is empty, the script will use the current chart ticker to extract the exchange name.

When checked, the AltAlgo will add a ticker to the alert message. When the checkbox is marked, and input field is empty, the script will use the current chart ticker, and if it contains PERP (USDT-m) in the name it will be removed. For example, BTCUSDTPERP will be converted to BTCUSDT because BTCUSDPERP can NOT be interpreted by Cornix.
For COIN-m futures PERP will be replaced by USD so ETHPERP will be converted to ETHUSD.

When checked, algo will add leverage information to the alert message.

These checkboxes add entry price (or entry zone if “DCA entry % of price” is set to a value greater than 0), Take-Profit levels (each in a new line) and Stop-loss level.

When checked, algo will put texts from inputs at the bottom of the alert message. You can use the placeholders described earlier.

You may also want the AltAlgo to send an alert when SL is hit. To do so, mark the checkbox and put free text separately for long SL and short SL. You can use placeholders described earlier in these fields.

There is an option to send alerts on every TP hit. It could be useful if you trade manually and for example you want to move SL to BE after TP1 hit or you use trailing after every take-profit level hit.

The below option will trigger additional alerts with all information set above to DCA enter. The only difference is that entry is no longer an entry zone but a standard price.

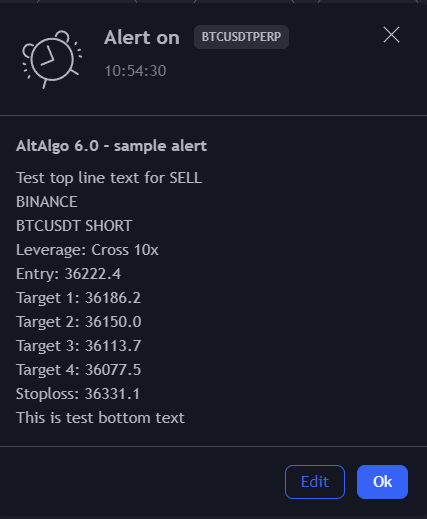
Examples of alerts without DCA entry and with DCA entry set:
4.13.1) Adding Alerts
To add an alert, you should click Add alert button in the Alerts tab in your TradingView

In the alert settings pop-up window you have to choose the AltAlgo and as condition “alert() function calls only” like on the screenshot below.
Set the rest of the options to suit your needs. You can enable a webhook and provide a webhook address if you want to send your alert to other apps (like Cornix, Integromat or Alertatron).
Alert name is filled by default by TradingView, but you can change it to anything you want.
When you click the “Create” button, TradingView will take a “snapshot” of your current chart data like the ticker, timeframe, used indicators and their settings, and your new alert will appear on the list of alerts in the alert tab. After alert creation, any change in AltAlgo settings on that same chart won’t affect alerts already created. Even when removing the indicator from the chart the alert will still work fine.

4.14) Volume Bar Analysis
Volume Bar Analysis (VBA) focuses on showing you important information about market behavior at a given price bar. Very often places on the chart where you can see increased traded volume are considered as points of interest, where price likes to come back. Volume analysis can also help predict trend exhaustion and swing reversals.

You can turn on VBA to color candles that have volume values above calculated volume standard deviation levels from the last x bars (STD Lenght). You can choose easily separate colors for up and down bars.
Churn Bar is a bar with high volume and low range (measured from high to low). It gives another layer of information about the price. It shows that on that specific level, there were a lot of buyers and sellers, but no one had enough strength to push the price significantly in a bull or bear direction. One can interpret this as accumulation before further movement or reverse. For Churn Bar, you toggle whether it shows and decide about the lookup period and multiplier. The lookup period is used to find the highest value of volume/range ratio on the last x bars and then check if the value is at least y times bigger than the average ratio for that period.
4.15) Properties tab

These are the default properties values. These values might not be realistic for your account
(capital of 10 000USD), but we suggest keeping them like this to have reliable backtest results.
If the order size is set too small, some coin pairs cannot be traded because of the minimum order size (SOL for example), so your backtest results will be different. If you want to experiment with different order sizes, you can do so.
4.15.1) Initial capital
Your whole equity is filled in here.
4.15.2) Base currency
This is merely a visual property and will list your profit in, for example USD / EUR/ …
4.15.3) Order size
The % amount of your equity you want to invest per trade or a fixed amount (for example 100 USD per trade) or number of contracts (useable for Forex).
4.15.4) Pyramiding.
This setting allows a strategy for multiple entries.
4.15.5) Commission.
These are the fees deducted per initiated trade. Please check your exchange if you want to use the exact values from the exchange that you use.
5) How to backtest?
For learning backtesting please refer to this video.
NOTE: the video is made for a previous version of the indicator but the process is still similar. With more functionality added the setups can even be improved compared to the ones in the video.
6) How to set up alerts and send them to a Telegram channel?
If you want to make your own signals channel with our indicator you can do this with Integromat (which is now named Make, it is a separate service and not associated with AltSignals, they have a usable free plan).
For how to set up please watch the following video.
7) How to develop strategies?
For how to develop strategies please watch the following video.
Additional information.
Some more general videos that are useful:
Helpful Tips ⚠️
🔹Trade with the Trend
🔹Anti-trend Signals will be short lived compared to trending signals
🔹Don’t over risk
🔹Practise with demo money first
🔹Take your time to watch the tutorials before attempting to use the scripts
General tips ⚠️
1: If the market is trending up be wary of short signals, they will generally not last long and will result in more false signals, keep this in mind & trade with the trend! Anti-trend trades will be short lived or quicker SL’s
2: If there is low volume be wary of signals, the range will likely be tight and difficult to trade
3: After a big move in the market the price will tend to range for some time and volume will drop as traders have been liquidated and are scared, small volume/range = more false signals
4: Learn basic technical analysis on YouTube, this will help you identify when false signals appear, such as entering a short when support has just been tested price is probably likely to bounce and hit the short SL for example
If you need access to any channels, please see pinned message in the group chat
https://t.me/c/1167145651/28718
404.php - How to Apply the AltAlgo Indicator in TradingView
Follow this guide to activate the AltAlgo Indicator on your TradingView account and start receiving buy/sell signals on your charts.
How to Apply the AltAlgo Indicator in TradingView
Automated technical analysis can help remove some of the guesswork in trading decisions. The AltAlgo Indicator is designed to provide clear buy and sell signals on TradingView charts, helping you make data-driven decisions with ease.
Overview:
The AltAlgo Indicator is an invite-only script provided to AltSignals subscribers. Once activated,
it overlays buy/sell signals on TradingView charts.
Step-by-Step Guide:
- Verify Your TradingView Username
Check that your TradingView username is correct in your AltSignals profile. This is required for us to grant access to the AltAlgo script. - Locate the AltAlgo Indicator
- Login to TradingView.
- Click your profile and open Profile Settings to double-check your username.
- Open any chart, click the Indicators button.
- Scroll to the “Invite-Only Scripts” section.
- If AltAlgo doesn’t appear, access may still be pending — contact support.
- Activate the AltAlgo Indicator on a Chart
- Click on the AltAlgo Indicator in the Invite-Only list.
- The indicator will be applied to your chart.
- Customize Settings & Read Signals
You may be able to adjust thresholds or alert preferences. Once applied, you’ll see:- Buy signals when favorable entry conditions are detected.
- Sell signals when it’s a good time to exit.
- Confirm Functionality
- If you don’t see any signals, try refreshing the chart or re-adding the script.
- If problems persist, contact support with your TradingView username and a screenshot.
Final Tips:
- Keep your TradingView username updated in your profile.
- Test the indicator on demo charts before applying to live trades.
- Watch for updates and usage tips shared in the community.
404.php - How to Automate Your Trading Using AltSignals
Learn how to connect AltSignals with Cornix and automate your trades on Binance, Bybit, and more — complete setup guide included.
How to Automate Your Trading Using AltSignals
Trading manually can be time-consuming and emotionally draining. That’s why many of our users prefer to automate their trades using platforms like Cornix, which seamlessly integrate with our Telegram signals and support major exchanges such as Binance, Bybit, OKX, and more.
Recommended Setup: Cornix Bot
We highly recommend Cornix as a trusted platform to automate your trades directly from our Telegram signals.
Click here to get started with Cornix:
AltSignals users get an exclusive 10% discount on Pro subscriptions.
Step-by-Step Guide to Automate with Cornix:
- Create a Cornix Account
Use the link above to register and complete signup using your email. - Set Your Telegram Username Correctly
Cornix links trades to your Telegram username, not your phone or email.
Go to your Telegram profile and ensure your username is set (starts with @yourname).
Use the same username in your AltSignals profile. - Connect Cornix to Telegram
Once logged in, go to Bot Settings > Add New Bot.
Start the Cornix bot and authorize it.
If prompted, select the AltSignals signal group. - Connect to Your Exchange
Go to the Cornix Dashboard > Exchanges > Add Exchange.
Select your exchange (e.g., Binance, Bybit) and securely enter your API keys.
Make sure withdrawals are disabled and trading is enabled. - Configure Auto-Trade Settings
Set your preferred trade sizes, risk levels, and rules for stop-loss/take-profit.
You can create global defaults or customize settings per signal type.
Example Automation Flow:
- Subscribe to AltSignals.
- Enter your Telegram and TradingView usernames.
- Connect Cornix to Telegram and your exchange.
- Receive signals via Telegram.
- Cornix executes the trades based on your config.
Final Tips:
- Always confirm your usernames are accurate in your AltSignals profile.
- Run a test trade before automating large orders.
- While we suggest Cornix, you’re free to use other automation tools.

